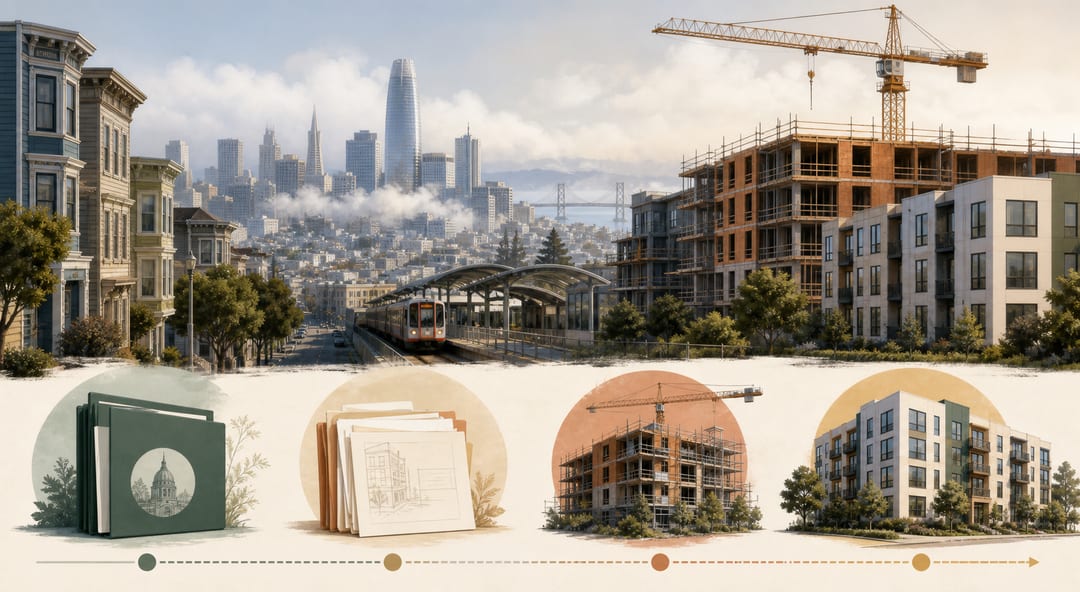
San Francisco’s housing debate is often reduced to a political scoreboard:
- pro-housing ideas became mainstream;
- more housing-focused candidates won office;
- state laws started limiting local obstruction; and
- the city still appears to be building too little, while rents and home prices remain painful.
That scoreboard captures a real frustration. It also mixes together several different clocks.
Changing a zoning rule is one clock. Filing a project is another. Winning an entitlement, securing financing, receiving a building permit, completing construction and reaching a rent level ordinary households can afford are all later clocks.
The honest answer is therefore two-part:
San Francisco has not produced housing at anything close to the scale of its need. But that does not prove every recent reform has already failed, because several of the most consequential changes are still moving through a multi-year project and implementation pipeline.
The more useful question is not whether a political movement “won.” It is which part of the housing system changed, how long ago it changed, and what the latest data actually measures.
Quick answer
If success means enough completed homes to meet San Francisco’s housing need, the answer is no. The city’s 2025 Housing Inventory reports a 2023–2030 RHNA allocation of 82,069 units and records 9,581 units of progress toward that target, or 12%. That progress measure includes units in the projection period, units authorized for construction, and acquisitions or conversions; it is not the same as 9,581 newly completed homes.
The same report says San Francisco added 2,669 net units in 2025, including 2,406 units from new construction. That was a recovery from 2024, but still 26% below the city’s ten-year average for net new units. The city authorized 1,953 gross new units for construction in 2025.
If success means the rules and political conditions have changed, there has been meaningful movement. San Francisco adopted its 2022 Housing Element in January 2023, California has expanded streamlined pathways for qualifying housing projects, and SB 79’s transit-oriented housing rules took effect on July 1, 2026.
Those changes can increase the number of projects that are legally possible. They do not instantly turn a zoning capacity number into a finished apartment, and they do not guarantee that the resulting homes will be affordable to every household.
The data problem: “housing production” is not one number
A city can look stalled on completed homes while showing activity in permits, entitlements and pipeline units. That is not necessarily a contradiction. It may mean projects are moving through different stages—or that many projects are stuck before construction.
| Metric | What it tells you | What it does not tell you |
|---|---|---|
| Political support | Whether elected officials and voters are changing the policy direction | Whether a building will be financed or completed |
| Zoning capacity | How much housing rules theoretically allow on a site | Whether a specific project is feasible |
| Application filed | A sponsor has formally proposed a project | Whether the proposal will be approved or built |
| Entitlement or planning approval | The project can proceed to the next development step | Whether financing, permits or construction will follow |
| Building permit or authorization | The project has cleared a major technical and legal stage | Whether units are occupied or affordable |
| Units under construction | Physical work has started | Whether the project will finish on its original schedule |
| Completed units | New homes have reached completion or occupancy milestones | Whether rents will immediately fall across the city |
| Net housing-stock change | New units adjusted for demolitions, alterations and conversions | Whether the units match the needs of a particular income group |
San Francisco Planning’s pipeline report makes this distinction explicit. Its pipeline includes projects with a formal land-use or building-permit application, ranging from early review to construction. A project leaves the pipeline after a Certificate of Final Completion, while units may move out earlier when they receive a Temporary Certificate of Occupancy.
Treating every pipeline unit as a completed home produces an overly optimistic picture. Treating only completed homes as evidence of whether a new policy has any effect can produce an overly short-term picture. Both numbers matter, but they answer different questions.
What the latest San Francisco numbers show
2025 was better than 2024, but still weak by historical standards
The city’s 2025 Housing Inventory reports:
- 2,406 units completed from new construction;
- 269 net units added through alterations, conversions, expansions or legalized accessory units;
- 6 units demolished; and
- 2,669 net new units added to the housing stock.
The report says the 2,669-unit net increase was 26% below the ten-year average of 3,622 net new units. New construction was also 26% below its ten-year average of 3,260 units.
The recent trend is uneven rather than a straight line downward. San Francisco recorded 4,996 units completed from new construction in 2020, 4,165 in 2021, 2,244 in 2022, 2,059 in 2023, 1,457 in 2024 and 2,406 in 2025. The 2025 rebound is real, but it did not restore the city to the level of the earlier years in that table.
The city also authorized 1,953 gross new units for construction in 2025, compared with 1,081 in 2024. That may become a future completion increase, but authorization is a leading indicator, not a finished-home count.
The pipeline is large, but most of it is not under construction
San Francisco’s 2026 Q1 pipeline report lists 74,888 total new pipeline units, including an estimated 19,065 affordable units. But its stage breakdown is more revealing:
- 3,301 units under construction;
- 1,219 with site building permits issued;
- 2,422 with building permits approved;
- 7,856 with building permits filed;
- 13,036 in applications under review; and
- 37,577 in major multi-phased projects.
This is not evidence that 74,888 homes are about to open. Half of the headline total sits in major multi-phased projects, and projects elsewhere in the pipeline may still face financing, design, permitting, labor, market and construction decisions.
It is evidence of something more limited but still important: the city has a substantial set of proposed or partially authorized projects, and the bottleneck is not only whether someone can imagine a building. The conversion from proposal to construction and completion remains the hard part.
The RHNA score is both alarming and easy to misread
San Francisco’s 2023–2030 RHNA allocation is 82,069 units:
| Income category | RHNA allocation |
|---|---|
| Very low income | 20,867 |
| Low income | 12,014 |
| Moderate income | 13,717 |
| Above moderate income | 35,471 |
| Total | 82,069 |
The 2025 Housing Inventory records 9,581 units of progress, or 12% of the target. That is far below the pace needed to finish the cycle comfortably.
But the progress calculation includes 2,085 projection-period units, 6,170 authorized units and 1,326 acquisition or conversion units. The city also explains that jurisdictions receive credit for units approved, permitted or built since the RHNA start date. A reader should not translate the 9,581 figure into “9,581 completed and occupied apartments.”
The income breakdown matters too. The report shows progress of 14% for very-low-income and low-income categories, 10% for moderate-income units and 10% for above-moderate units. That does not mean the affordable-housing problem is solved; it means the city is tracking different categories against different targets.
Why policy changes take so long to appear in completion data
A policy win changes the starting line, not the finish date
Suppose a state law says a qualifying project may use a streamlined or ministerial approval route. That can remove a discretionary barrier. The sponsor may still need to:
- assemble or control the site;
- design a project that meets objective standards;
- satisfy affordability, labor, environmental and building requirements;
- secure financing;
- obtain the required permits;
- contract for construction;
- build through inspections and occupancy; and
- lease or sell the completed units.
Removing one delay does not eliminate the others. It can also take time for developers, lenders, architects and public agencies to learn how a new pathway works and decide which sites are feasible.
San Francisco’s own Housing Element update says some implementing programs would take a few years to launch, while more complicated programs could take five years or more. That is a policy document’s forecast, not a promise that every program will work. It does explain why judging a 2023 plan solely by 2023 or 2024 completions would be premature.
SB 79 is a future supply tool, not a completed-homes report
California’s SB 79, signed in 2025, creates rules for qualifying transit-oriented housing developments near specified transit stops in urban transit counties. The state Department of Housing and Community Development says the law makes qualifying projects an allowed use on certain residential, mixed-use or commercial sites and took effect on July 1, 2026.
That is a meaningful change in the legal baseline. It is not a claim that San Francisco has already built the homes SB 79 may enable. The law still depends on project eligibility, objective standards, affordability requirements, site conditions, implementation guidance, local maps and the ordinary realities of development.
The best near-term test is therefore not “Did SB 79 lower rents in August 2026?” It is:
- Are the eligible areas clearly mapped?
- Can a sponsor identify viable sites?
- Are applications actually being filed?
- Are projects receiving approvals and permits?
- Are units under construction?
- Do completions and affordability match the statutory goals?
Those are leading and lagging indicators. The lag is part of the policy design, but it should not become an excuse for indefinite nonperformance.
Why rents can stay high even when new housing is being built
New housing does not need to be below-market-rate to be socially irrelevant. Market-rate units can add choices, absorb households that would otherwise compete for older units and reduce pressure on some parts of the housing stock. But that effect is gradual, uneven and dependent on scale.
At the same time, new construction can be expensive. A building may be permitted but not financially feasible at the proposed rent. A project may be redesigned, delayed, downsized or withdrawn. Affordable housing adds another layer of financing and subsidy requirements, even when the policy goal is clear.
The city’s pipeline report itself warns that it includes projects at many stages and uses estimates for some affordable units where the final inclusionary approach has not yet been determined. That is useful for planning, but it means a pipeline headline should not be treated as a guaranteed affordability outcome.
Demand also matters. San Francisco is connected to high-wage employment, regional transit and a constrained land market. A supply increase can be real without being large enough to offset new demand, household formation, returning workers, investor behavior or the loss of older units.
The claim that a technology boom caused apartments to rise by a precise percentage year over year should be treated cautiously unless it identifies the neighborhood, unit type, time period, sample and source. A few highly visible listings or luxury transactions cannot describe the entire city. The same caution applies to claims that every new building is unaffordable or that every new unit immediately lowers rents.
Is the problem homeowners, developers, government—or all three?
The debate often assigns the entire explanation to one group. The data suggests a chain of constraints instead.
| Constraint | How it can slow housing | What a useful test looks like |
|---|---|---|
| Local zoning and discretionary review | Fewer sites or longer entitlement timelines | Compare applications, approvals and objective review timelines |
| Community appeals or project changes | Delays, redesigns and added uncertainty | Track the project’s milestone dates and reasons for changes |
| Financing and construction feasibility | A legal project may not obtain a loan or start work | Compare approved, permitted and under-construction units |
| Public funding | Affordable projects may need subsidies or layered financing | Track funded versus proposed affordable pipeline units |
| Infrastructure and transportation | Growth may require public investment and coordination | Compare housing approvals with transit, utilities and service capacity |
| Labor, materials and insurance | Costs can make a project unfinanceable | Review project budgets and construction-start rates |
| Demand and job growth | New units may be absorbed without visible rent relief | Track vacancy, rents, household formation and employment together |
| Tenant protection and preservation | Replacing units is not the same as preserving residents | Track displacement, preservation and affordability by income level |
That list is not a reason to accept delay forever. It is a reason to avoid a one-cause explanation. Making zoning more permissive can be necessary and still insufficient. Funding affordable housing can be necessary and still insufficient. Better transit can support housing and still not create a building by itself.
A better way to judge whether the movement is working
Use a five-stage scorecard and give each stage its own deadline.
1. Rules
Did the city and state create clear, enforceable pathways for more housing in appropriate locations? Are objective standards actually objective? Can applicants understand which rules apply?
2. Applications
Are more projects being filed, and are they distributed across the city rather than concentrated in a few large development agreements? San Francisco reported 289 projects with 9,614 units filed at Planning in 2025.
3. Approvals and permits
Are projects being approved at the proposed unit counts, and are approvals converting into building permits? San Francisco reported 274 projects with 3,723 units approved at Planning in 2025, while DBI authorized 1,953 gross new units for construction.
4. Construction and completion
Are starts and completions rising over several years? The city’s 2,406 new-construction completions in 2025 were better than 2024 but still below the ten-year average.
5. Outcomes
Are vacancy, rent burdens, displacement, family housing, affordable units and access for lower-income households improving? Production is a necessary input, not the entire housing outcome.
This scorecard prevents two opposite mistakes. One is declaring victory when a large pipeline exists. The other is declaring every policy useless because the housing market has not reset within one election cycle.
So, has San Francisco’s YIMBY movement failed?
As a housing-production program, it has not yet delivered enough. San Francisco is far behind its RHNA target, annual net additions remain below historical averages and the majority of the large pipeline is not under construction.
As a policy and political shift, it is too early to judge the full effect of the newest tools. The Housing Element was adopted in 2023, the city’s own implementation schedule anticipated multi-year work, and SB 79 only took effect in July 2026. A completed-unit response to those changes may take years.
But “too early” should be used carefully. It is a reasonable explanation for why a new law has not yet lowered rents. It is not a defense for weak applications, stalled permits, unaccountable delays or failure to measure whether projects are actually moving.
The strongest conclusion is therefore neither triumph nor collapse:
San Francisco has changed the direction of its housing policy, but it has not yet changed the scale of its housing supply. The next few years should be judged by conversion—rules into applications, applications into permits, permits into construction, and construction into homes that people at different income levels can actually occupy.
Frequently asked questions
Is San Francisco building less housing than ever?
That depends on the measure and period. The city’s 2025 report shows 2,406 new-construction completions and 2,669 net new units in 2025, both below the ten-year averages listed in the report. The longer historical table shows large year-to-year variation, so “ever” is too broad without defining the metric.
Does the 82,069 RHNA number mean San Francisco must finish 82,069 homes immediately?
No. It is the city’s allocation for the 2023–2030 planning period, divided by income category. Progress is tracked through a combination of units built, authorized, acquired or converted, and other credits recognized in the state and regional process.
Does a 74,888-unit pipeline mean San Francisco is about to get 74,888 homes?
No. The pipeline includes projects at different stages. The 2026 Q1 report lists 3,301 units under construction and many more in applications, permits or major multi-phase projects. Pipeline units are not equivalent to completed homes.
Can market-rate housing help affordability?
It can add supply and reduce competition for some existing homes, but the effect depends on scale, location, demand and time. Market-rate construction does not automatically produce homes affordable to very-low-income households.
What does SB 79 change?
SB 79 creates a state framework for qualifying transit-oriented housing developments near specified transit stops in urban transit counties. HCD says it took effect July 1, 2026. It changes what may be allowed on eligible sites; it does not guarantee that every eligible site will be developed.
How long should residents wait before judging a housing reform?
Use different review dates for different indicators. Rules and applications can be reviewed quickly; permits and construction require longer; citywide rents and displacement require sustained production and broader market analysis. A policy should have milestones at each stage rather than one vague promise to wait.
A practical way to organize the housing question
Housing policy evidence is spread across planning documents, permit records, pipeline dashboards, affordability tables, meeting materials and market data. Put those sources into one timeline and label each number as proposed, approved, permitted, under construction, completed or preserved.
19pine can help organize policy documents, project records, data links and questions into a clear research file for your next conversation with a planner, housing advocate, developer, journalist or public agency. It does not predict rents, verify a project’s legal status or replace professional analysis.
Official sources
- San Francisco Planning Department: 2025 Housing Inventory
- San Francisco Planning Department: 2025 Housing Inventory PDF
- San Francisco Planning Department: Housing Element 2022 Update
- San Francisco Planning Department: Housing Element goals and policies
- San Francisco Planning Department: Housing Pipeline Report
- DataSF: Housing Production, 2005–present
- DataSF: San Francisco Development Pipeline
- MTC/ABAG Vital Signs: Housing Production
- MTC/ABAG Vital Signs: Housing Permits
- California HCD: Streamlined Ministerial Approval Process, SB 35/SB 423
- California HCD: SB 79 Transit-Oriented Development
- California Legislature: SB 79 bill text
- MTC: SB 79 regional map
Disclaimer: This article provides general information about San Francisco housing policy and production data. It is not legal, financial, investment, development, planning or housing advice. It focuses on San Francisco and California sources reviewed on August 20, 2026. Housing data definitions, policy implementation, market conditions and project status can change. Verify current records and consult a qualified local professional before making a development, purchase, financing or advocacy decision.